COVID-19: How Understanding Data Helps Us All
COVID-19 has had a profound impact on all aspects of our global society since its first...

Increasingly, companies are concerned with the image and perception of people, organizations, or products in social media and news articles, whether for the purposes of brand management, public relations, market research, or monitoring propaganda. As part of a rich text analytics platform, Rosoka Series 6 is at the forefront of sentiment analysis, providing meaning to data with scientific accuracy. The insights gained from these metrics direct companies toward better, more informed decisions, giving them an edge on their competition.
Unlike traditional approaches to sentiment analysis, Rosoka's advancements describe an author's perceived intent and examine the likeliness of reaction from the intended audience across four variables: polarity, mood, intensity, and aspect. You are informed to positive or negative sentiment (polarity), the author's perceived mood, the level of emotional control the text exerts (aspect), and how motivated the audience may be to react (intensity). This is critical information that organizations need in order to respond to events and industry trends. In addition to these four metrics, Rosoka also reports the salience of each entity extracted, indicating how important that entity is within the document. Rosoka’s sentiment analysis data is research-driven, leveraging a robust body of psycholinguistic work to provide accurate and consistent results.
Customers leverage Rosoka’s sentiment metrics in a variety of ways. To demonstrate the type of analytics that Rosoka’s metadata facilitates, we collected a set of tweets mentioning President Donald Trump. The Rosoka Series 6 engine performed entity and relationship extraction, sentiment analysis, salience determination, and geotagging on all tweets (for our purposes, one tweet is the equivalent of a “document”). Three example tweets are shown in Figure 1, along with corresponding sentiment metrics. All metrics are reported on a scale from - 3 to +3 except intensity, which ranges from 0 to +3.
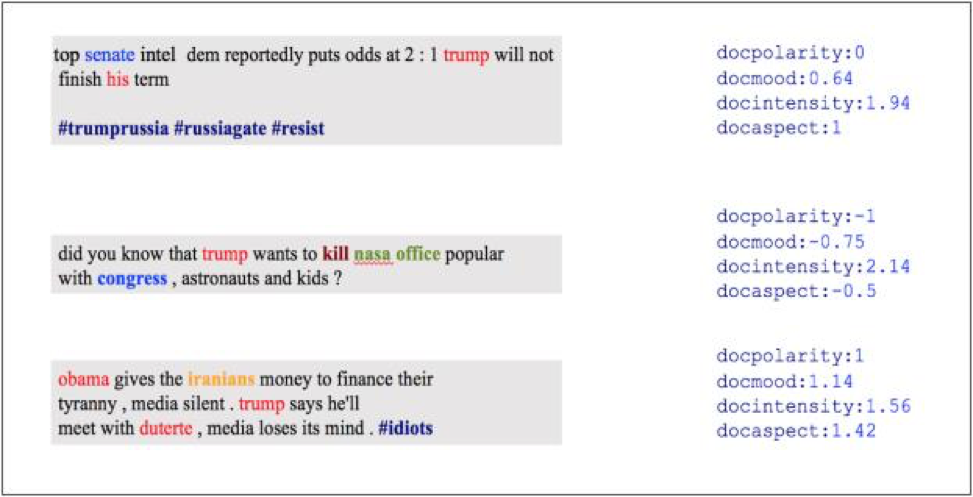
Figure 1. Three sample tweets, with corresponding sentiment metrics.
From these metrics, we infer that the derisive and rather sarcastic third tweet makes readers feel more control than the somewhat condescending “did you know” question in the second tweet. The first tweet, minus the content of the hashtags, is reporting a claim without commentary, resulting in a neutral polarity, but a somewhat high intensity or level of activation. This type of information, while interesting, does not allow users to draw conclusions about a general attitude toward President Trump, the level of influence of the tweets, or how varied opinions tend to be.
To make generalizations based on these metrics, we look at the group of tweets as a whole. Figure 2 plots aspect and mood scores for each individual document, with the size of each circle indicating intensity (i.e., larger circles indicate documents with higher intensity).
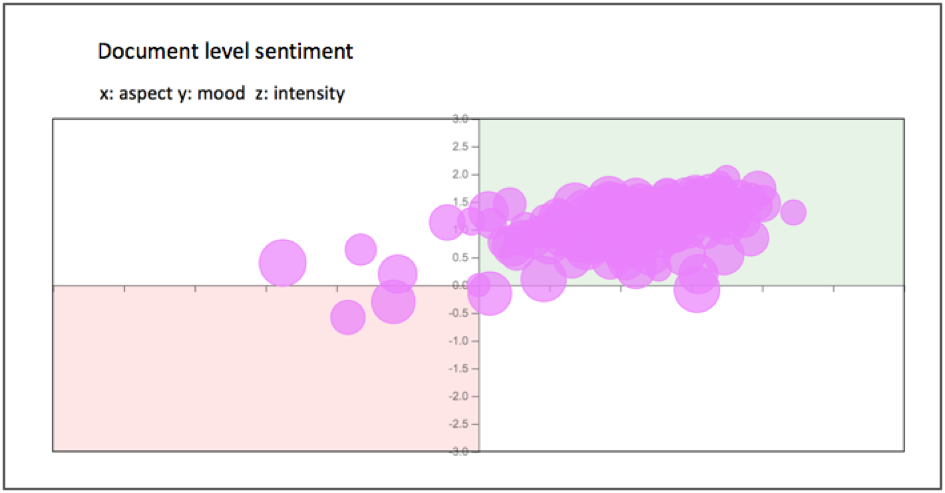
Figure 2. Document level sentiment metrics for all documents.
This visualization provides information about the emotional language of the tweets, the degree of control a reader is likely to feel, and the intensity of the language. From this, we see that most of the tweets in this collection have a slightly positive mood, and readers are likely to feel in control in most cases. We can easily identify a handful of outliers in the two quadrants on the left that warrant further exploration. We can also use this type of analysis to group documents by data source or language use. For example, news articles are typically less likely to use emotional language than social media data. This visualization would surface these types of distinctions.
To drill down into sentiment about a specific person (or organization, or product, or hashtag, etc.), we look at the sentiment metrics about only that entity, across the collection of documents. Figure 3 shows the sentiment of Donald Trump in each of the documents that mentions him. The metrics used here are polarity and mood, with size indicating intensity.
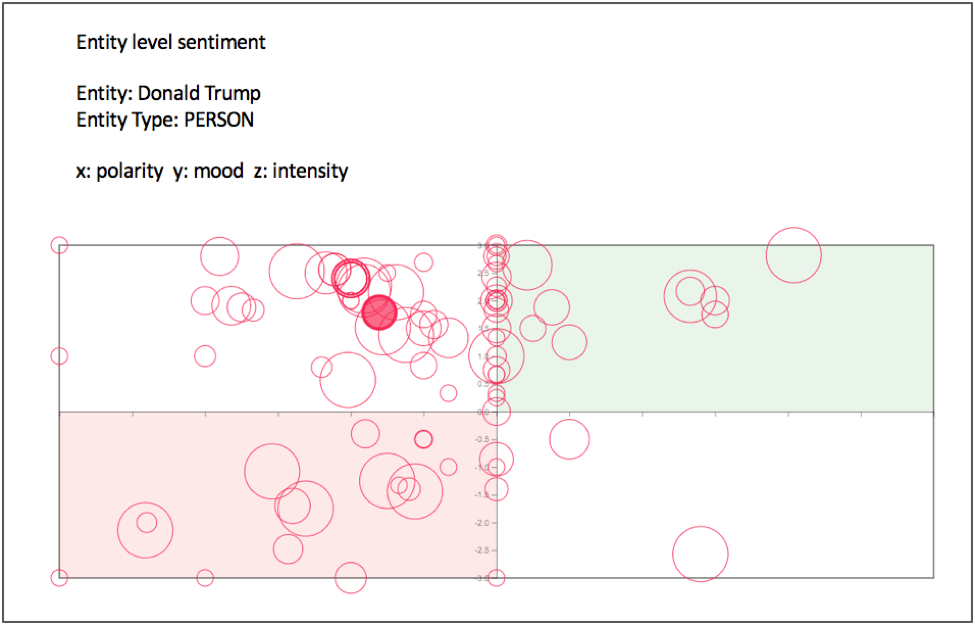
Figure 3. Entity sentiment across collection of documents.
Here we see polarity and mood values both ranging from positive to negative, not clustering in a specific quadrant. This indicates that the documents represent a variety of valences and emotions. The opaque red circle represents the mean values of polarity and mood. The mean polarity value is slightly negative, while the mean mood value is quite positive. This indicates that the majority of these documents’ authors use language that is positive about an event that may be perceived as objectively negative, such as deportations or airstrikes.
Rosoka Series 6 provides a rich output with a lot of information. Understanding how to use this information to draw conclusions and make data-driven decisions is crucial to solving your business problem. At Rosoka, we are happy to discuss your specific use case, and help you determine the best path forward using our valuable metadata. Please contact info@rosoka.com for more information about our products, about sentiment analysis, or to schedule a demo!
COVID-19 has had a profound impact on all aspects of our global society since its first...
Data is one of the most important resources for any organization. It’s what drives organizational...
Natural language processing (NLP) is a type of artificial...